Error metrics in the dashboard

You can now see error metrics in the dashboard to quickly understand what errors are happening and how often.

Changelog 1 min read

Written by

Dmytro Krasun

Published on

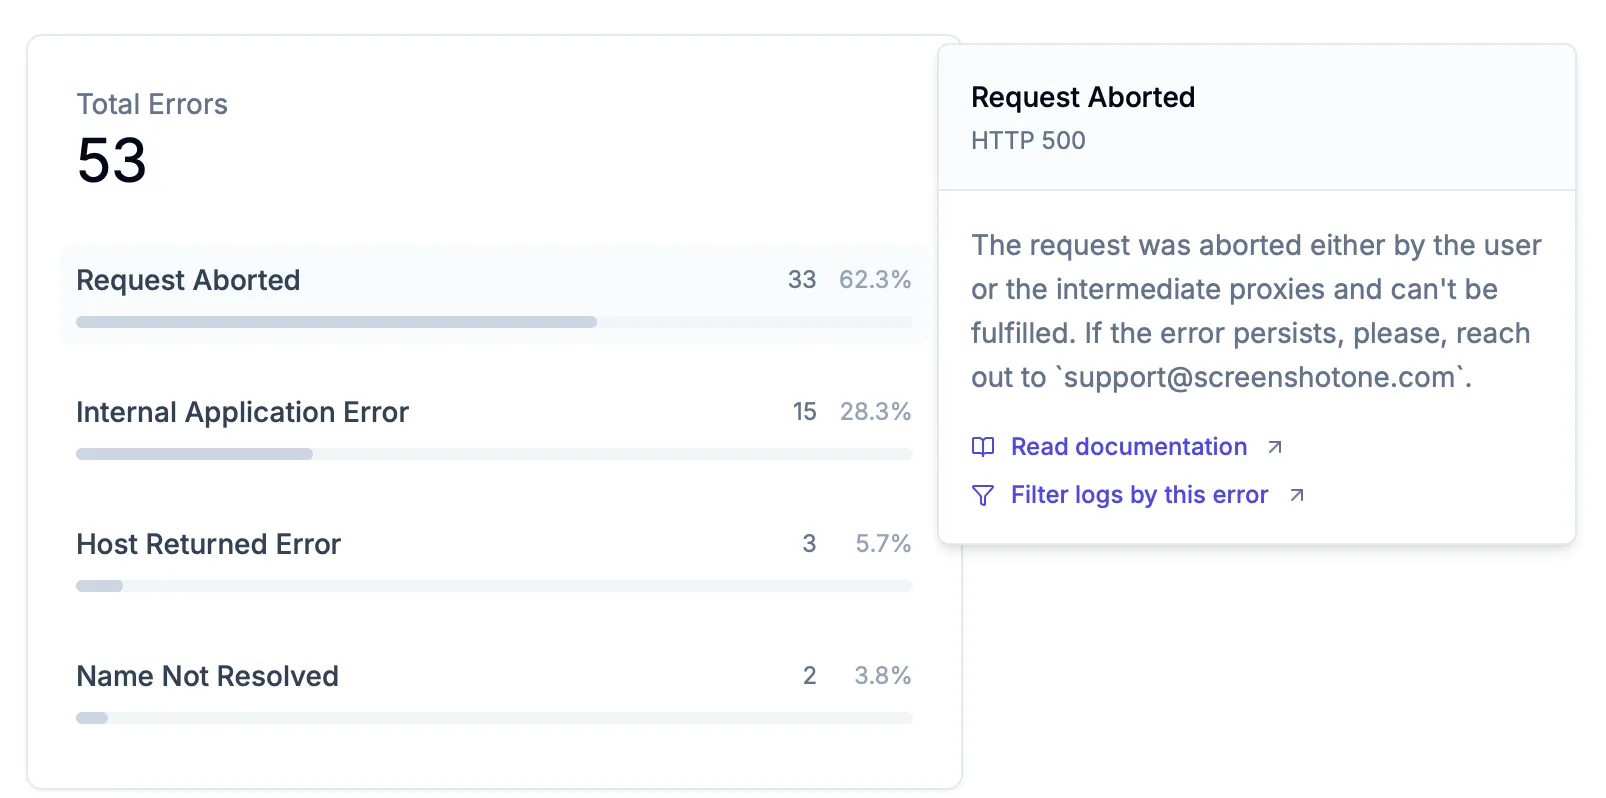
We have added a new error metrics widget to the dashboard that shows you the errors happening with your rendering requests.

The widget displays:

  1. Total number of errors for the selected time period (last 24 hours, 7 days, 15 days, or 30 days).
  2. Each error with its title, count, and percentage.
  3. Detailed tooltips with error descriptions, HTTP status codes, and links to documentation.
  4. Quick access to logs by clicking on any error.

The errors are sorted by count, so you can quickly see the most common errors and take action:

A screenshot of the new error metrics widget

If you have any questions, suggestions, or feedback, please contact us.

Read more product updates

New features, bug fixes, and optimizations...

View all product updates
Fail if there is nothing to click on

Fail if there is nothing to click on

A new option has been added to fail or not to fail the screenshot rendering if there is nothing to click on.

Read more

1 min read

I migrated to Google Cloud

I migrated to Google Cloud

Google Cloud gives $300 in credits for 3 months for experimenting. And I decided to give it a try, but not because of the free credits.

Read more

4 min read

Better numbers formatting in the dashboard

Better numbers formatting in the dashboard

We improve UI/UX of rendering numbers in the dashboard for better readability.

Read more

1 min read

Automate website screenshots

Exhaustive documentation, ready SDKs, no-code tools, and other automation to help you render website screenshots and outsource all the boring work related to that to us.