For three days, I have been hunting an issue that caused one of my uptime monitors to go wild. I could barely sleep.
I fixed it. No customers were impacted at all.
But before you laugh and judge me, please read.
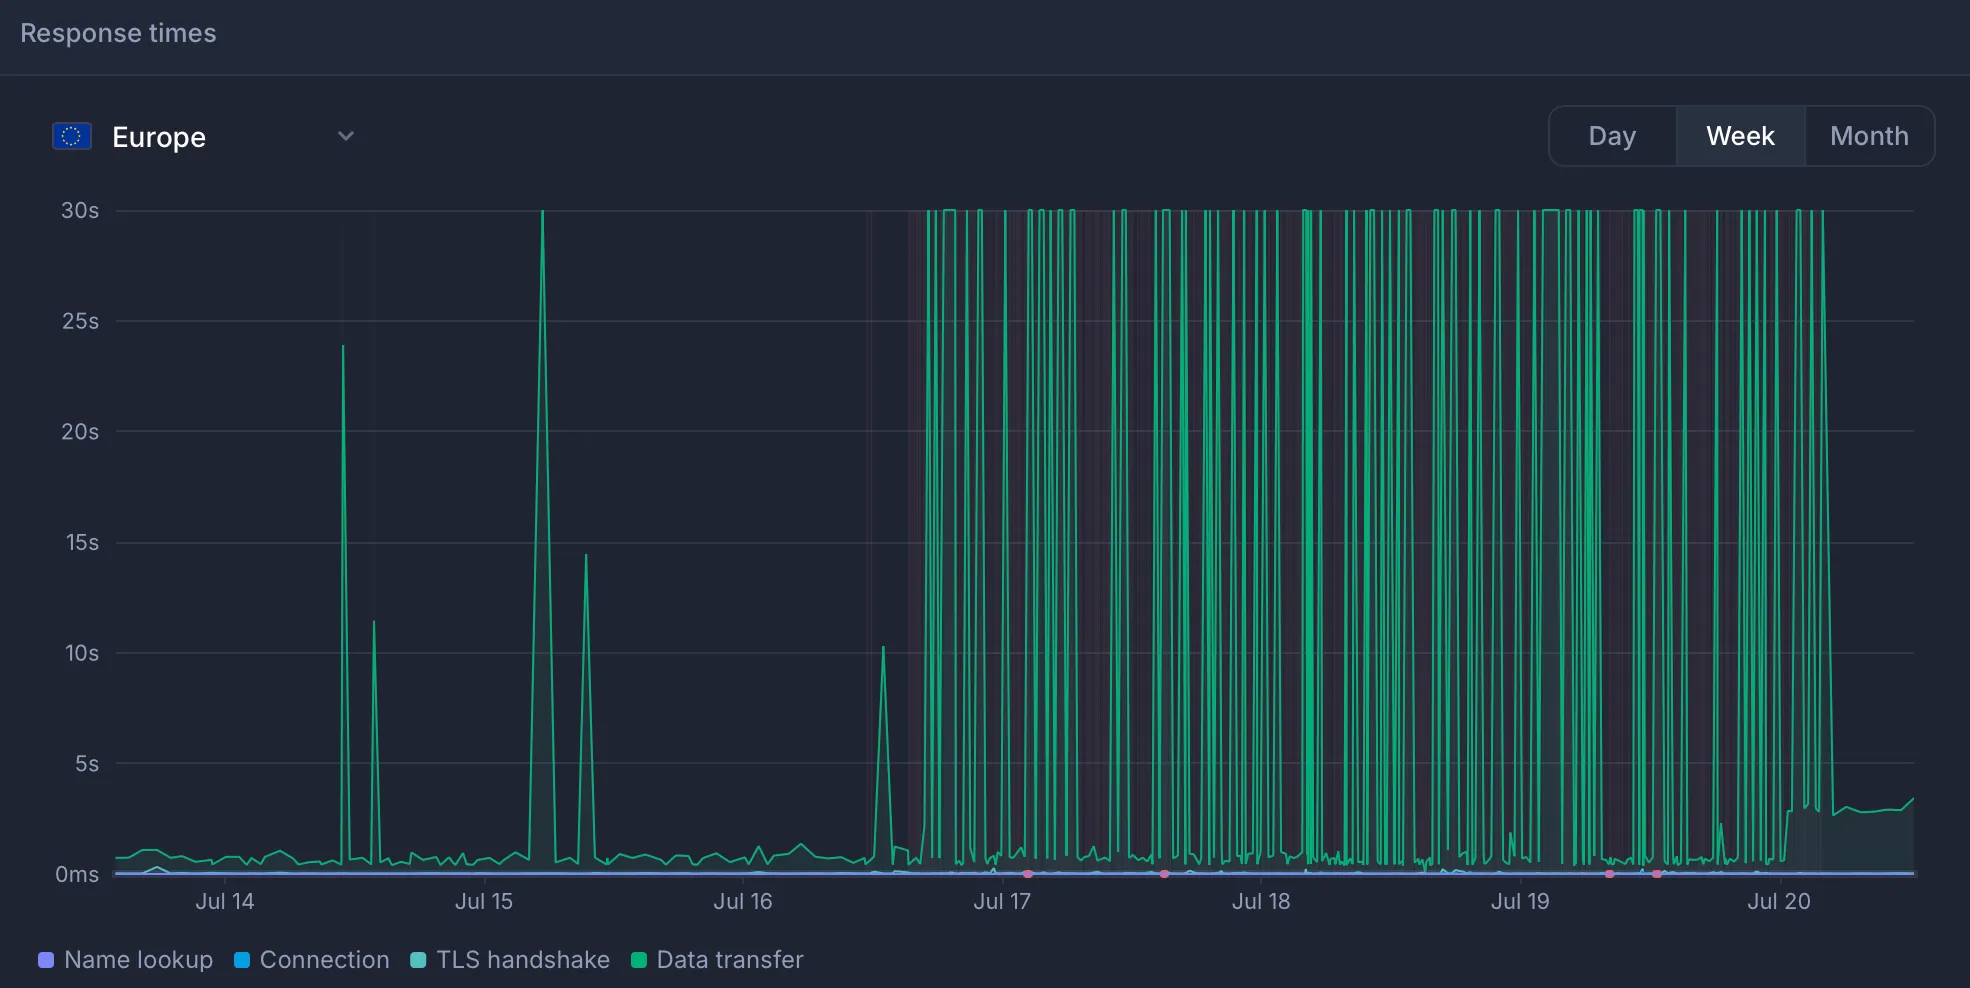
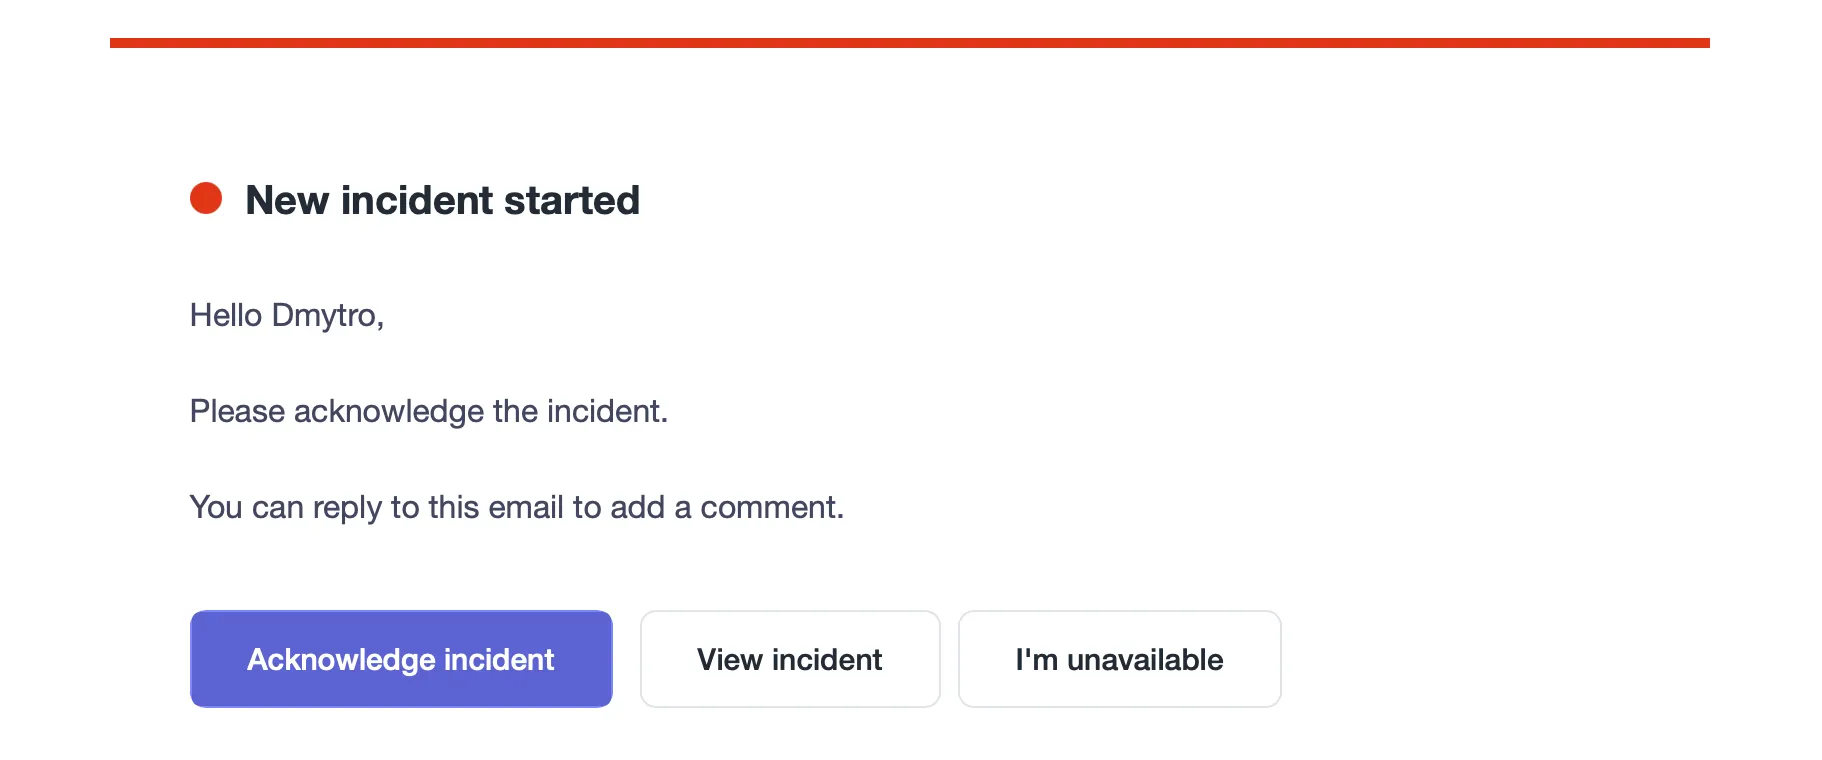
One of the monitors started to alert
On July 17, one of my monitors that checks real rendering with browsers started to alert me about timeouts.
I immediately checked other critical monitors, especially the main API gateway, and everything was working without any issues.
I started debugging…
Everything was working fine
I checked if the API receives a ton of new requests and is overloaded, but the cluster just can’t keep up with autoscaling.
But not, everything was as usual.
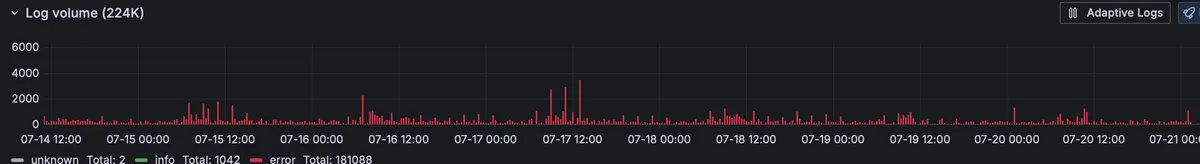
Let’s then check if there is increased load on the cluster. Maybe a new API usage pattern that causes degraded performance?
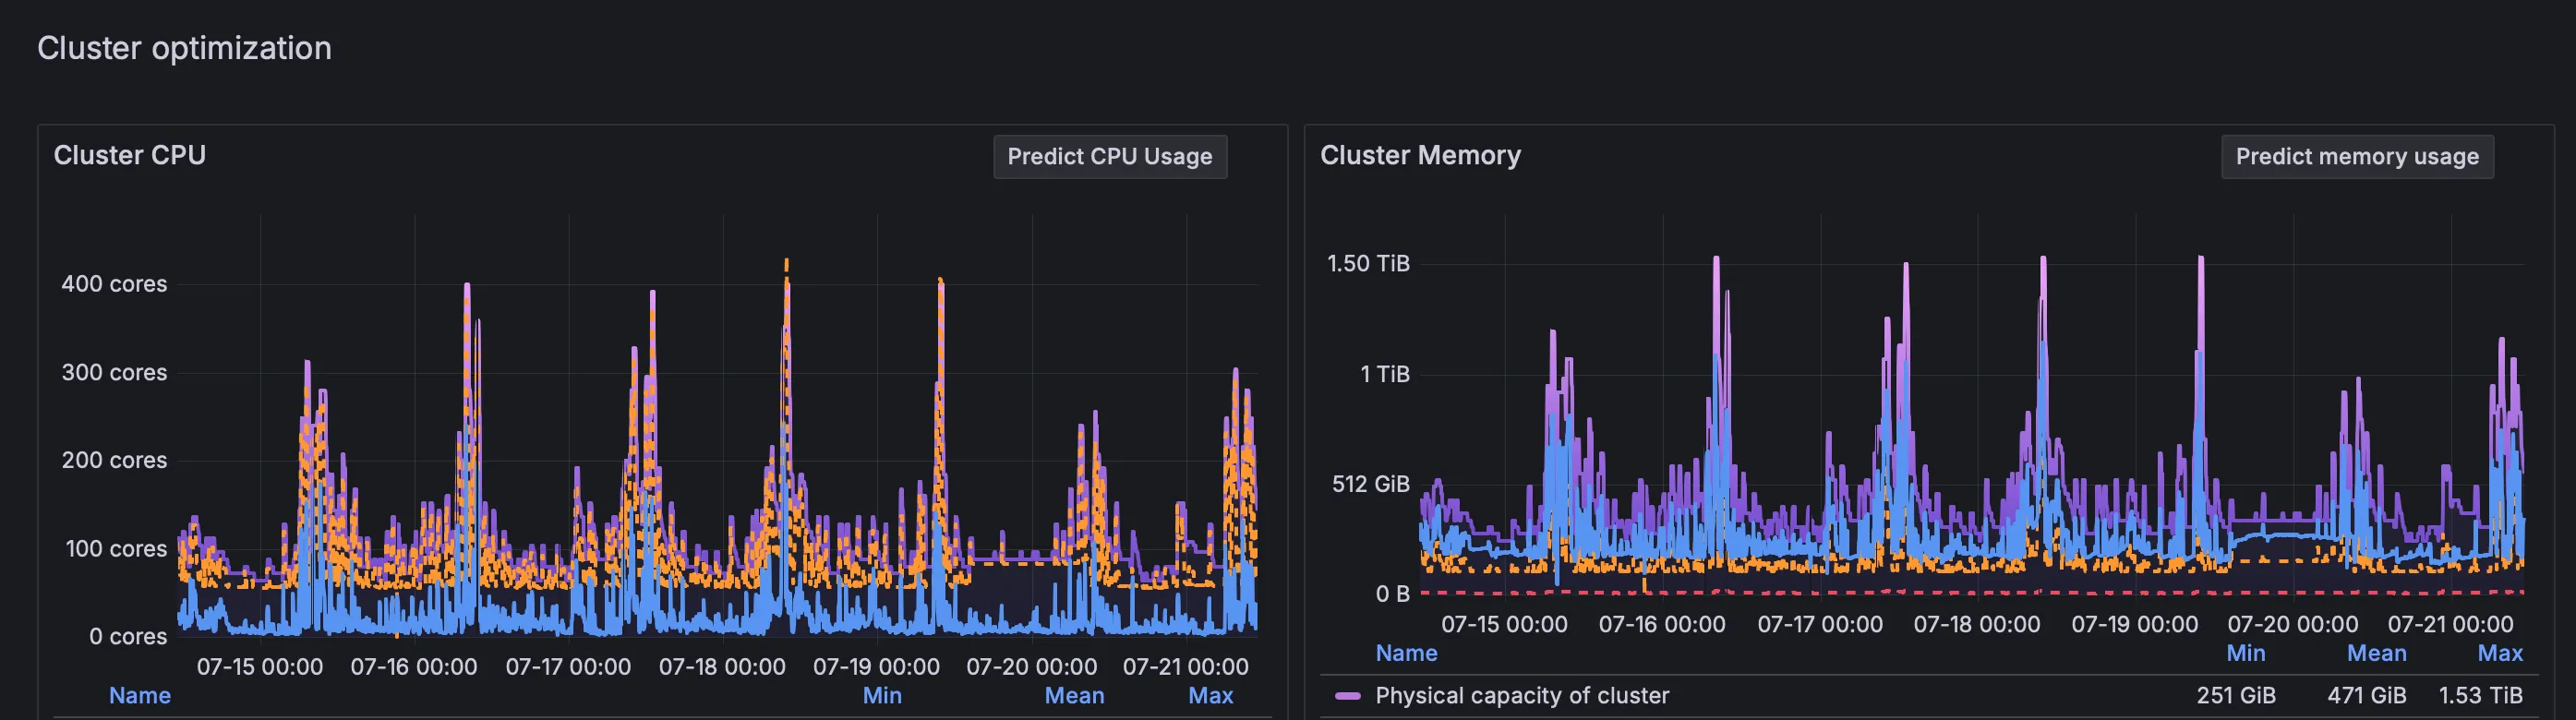
No, the usage pattern was like it was any other day.
I decided to check our changelog. Maybe I deployed something that causes timeouts but doesn’t impact the load.
But most commits were related to improving rendering and blocking banners and ads. I reverted them anyway, but it didn’t help. I was still receiving alerts.
Of course, I asked ChatGPT, and other LLMs, describing all the inputs I had and sharing all the screenshots.
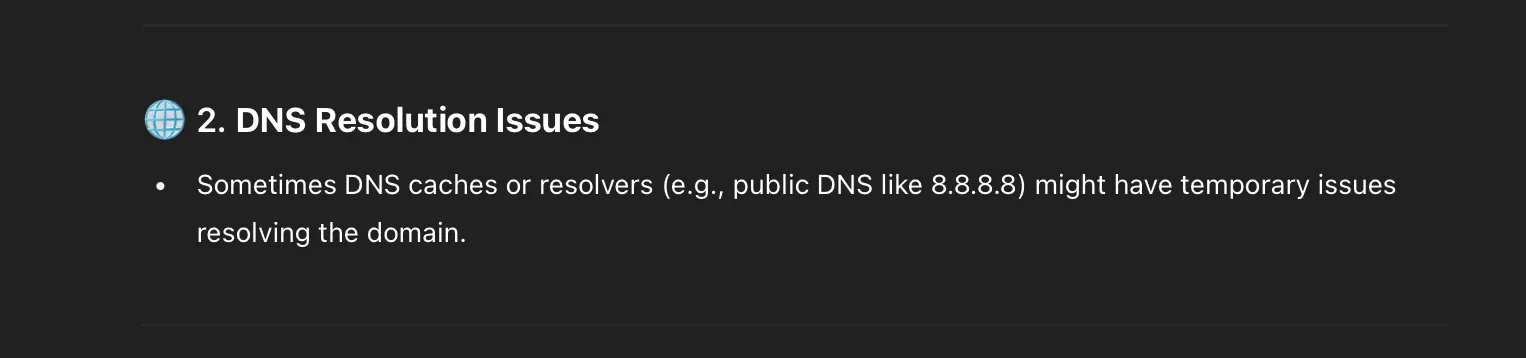
Damn, of course, I should have checked networking.
I wrote a tool to diagnose DNS resolution performance and networking connections, deployed it to the cluster, and… no issues! The networking was stable.
Damn! It was day two. The world was falling apart. I started to traverse code…
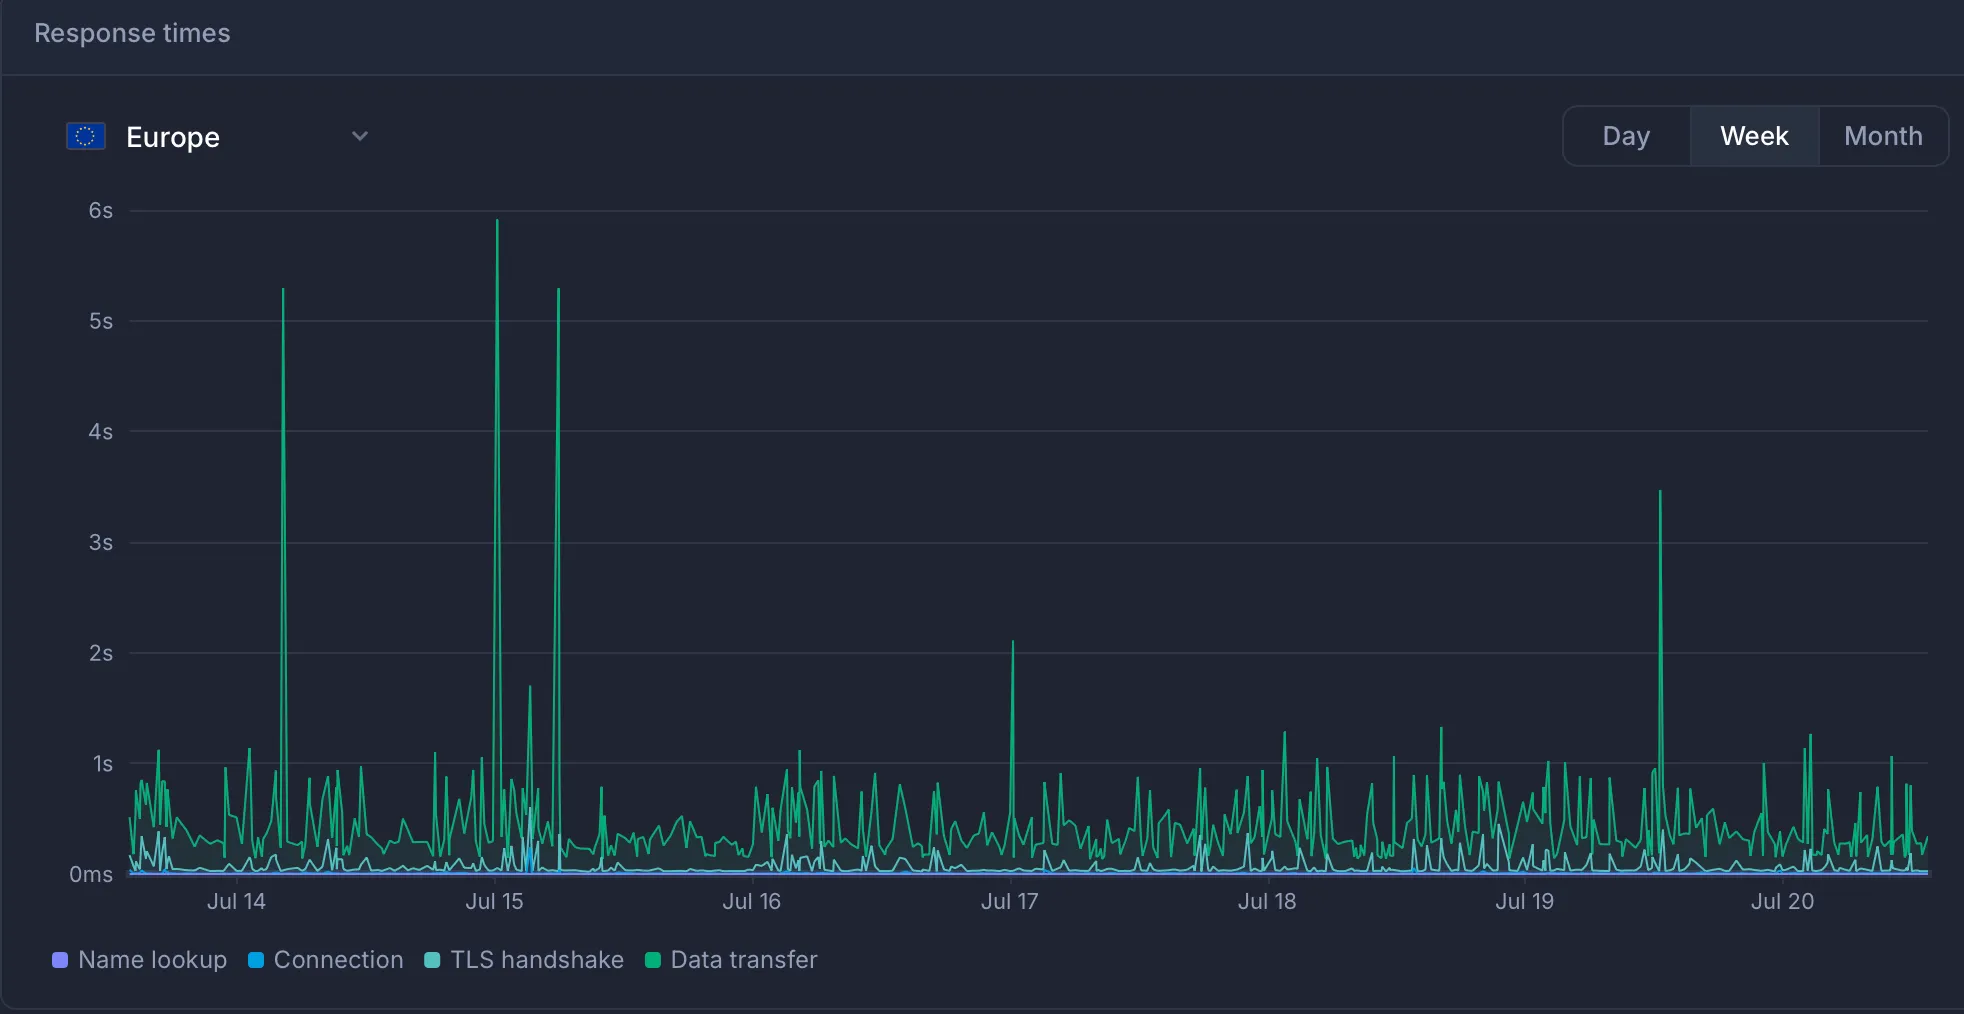
Turns out this monitor check was bypassing browser locks and interfering with actual rendering. I created a real account and started to use it for monitoring. And…
It didn’t help:
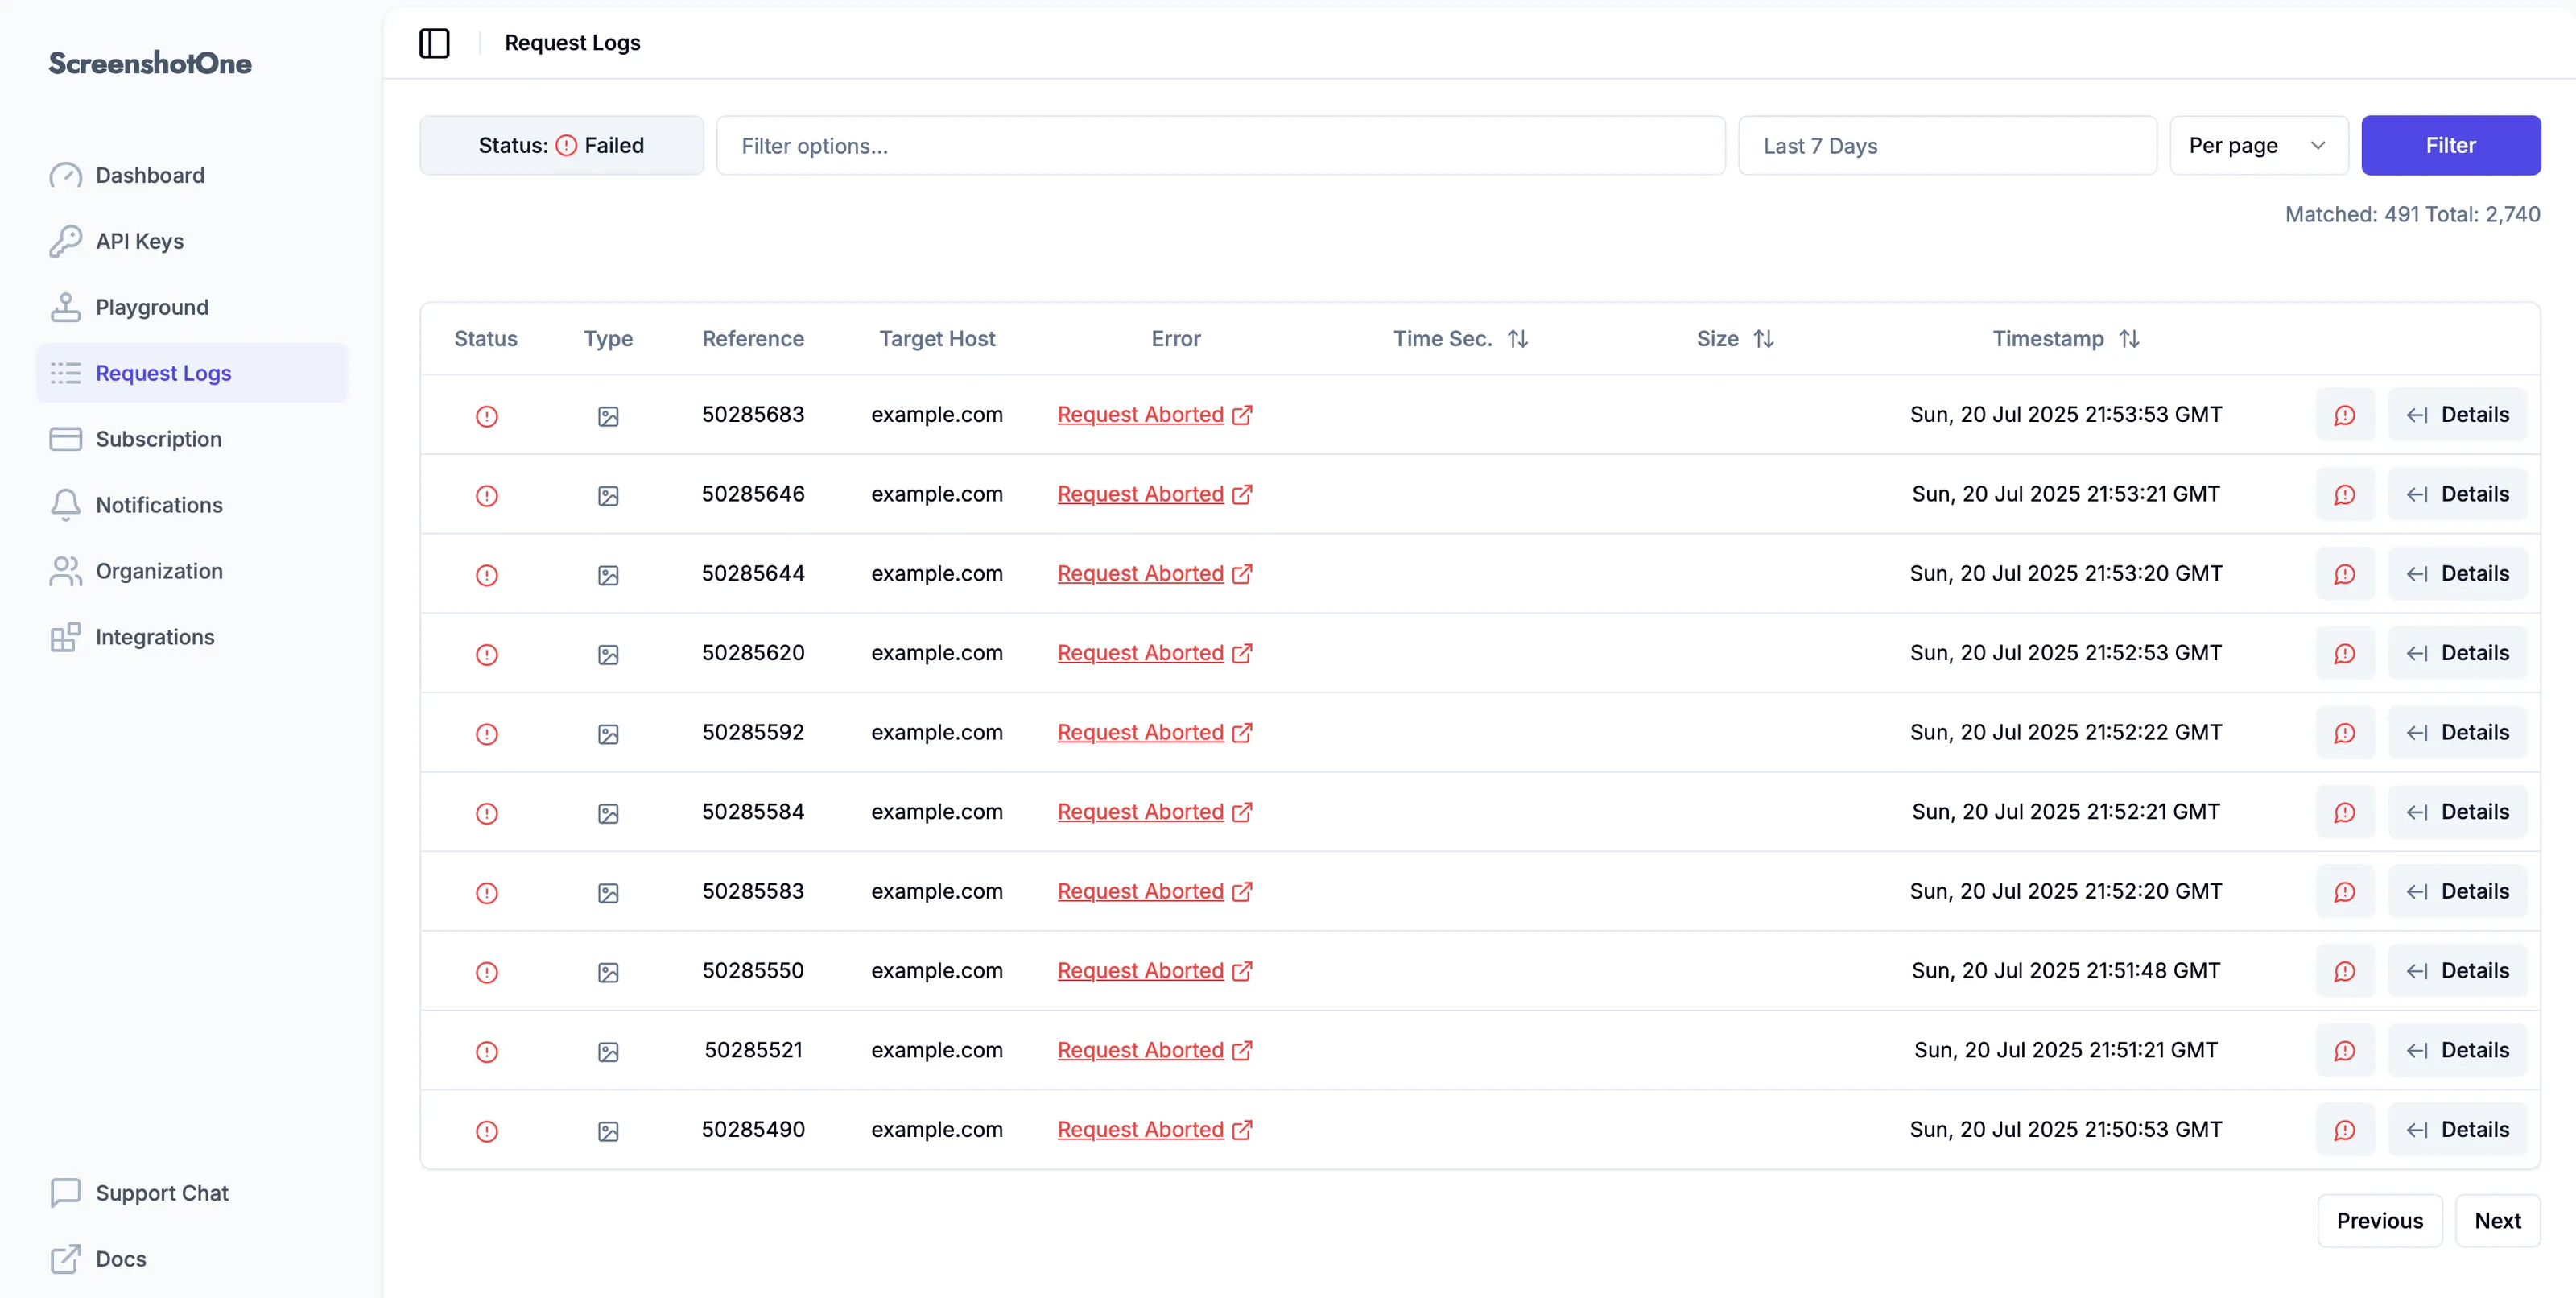
Rendering worked perfectly for my customers, though. Their success rates are within the norm for their use cases.
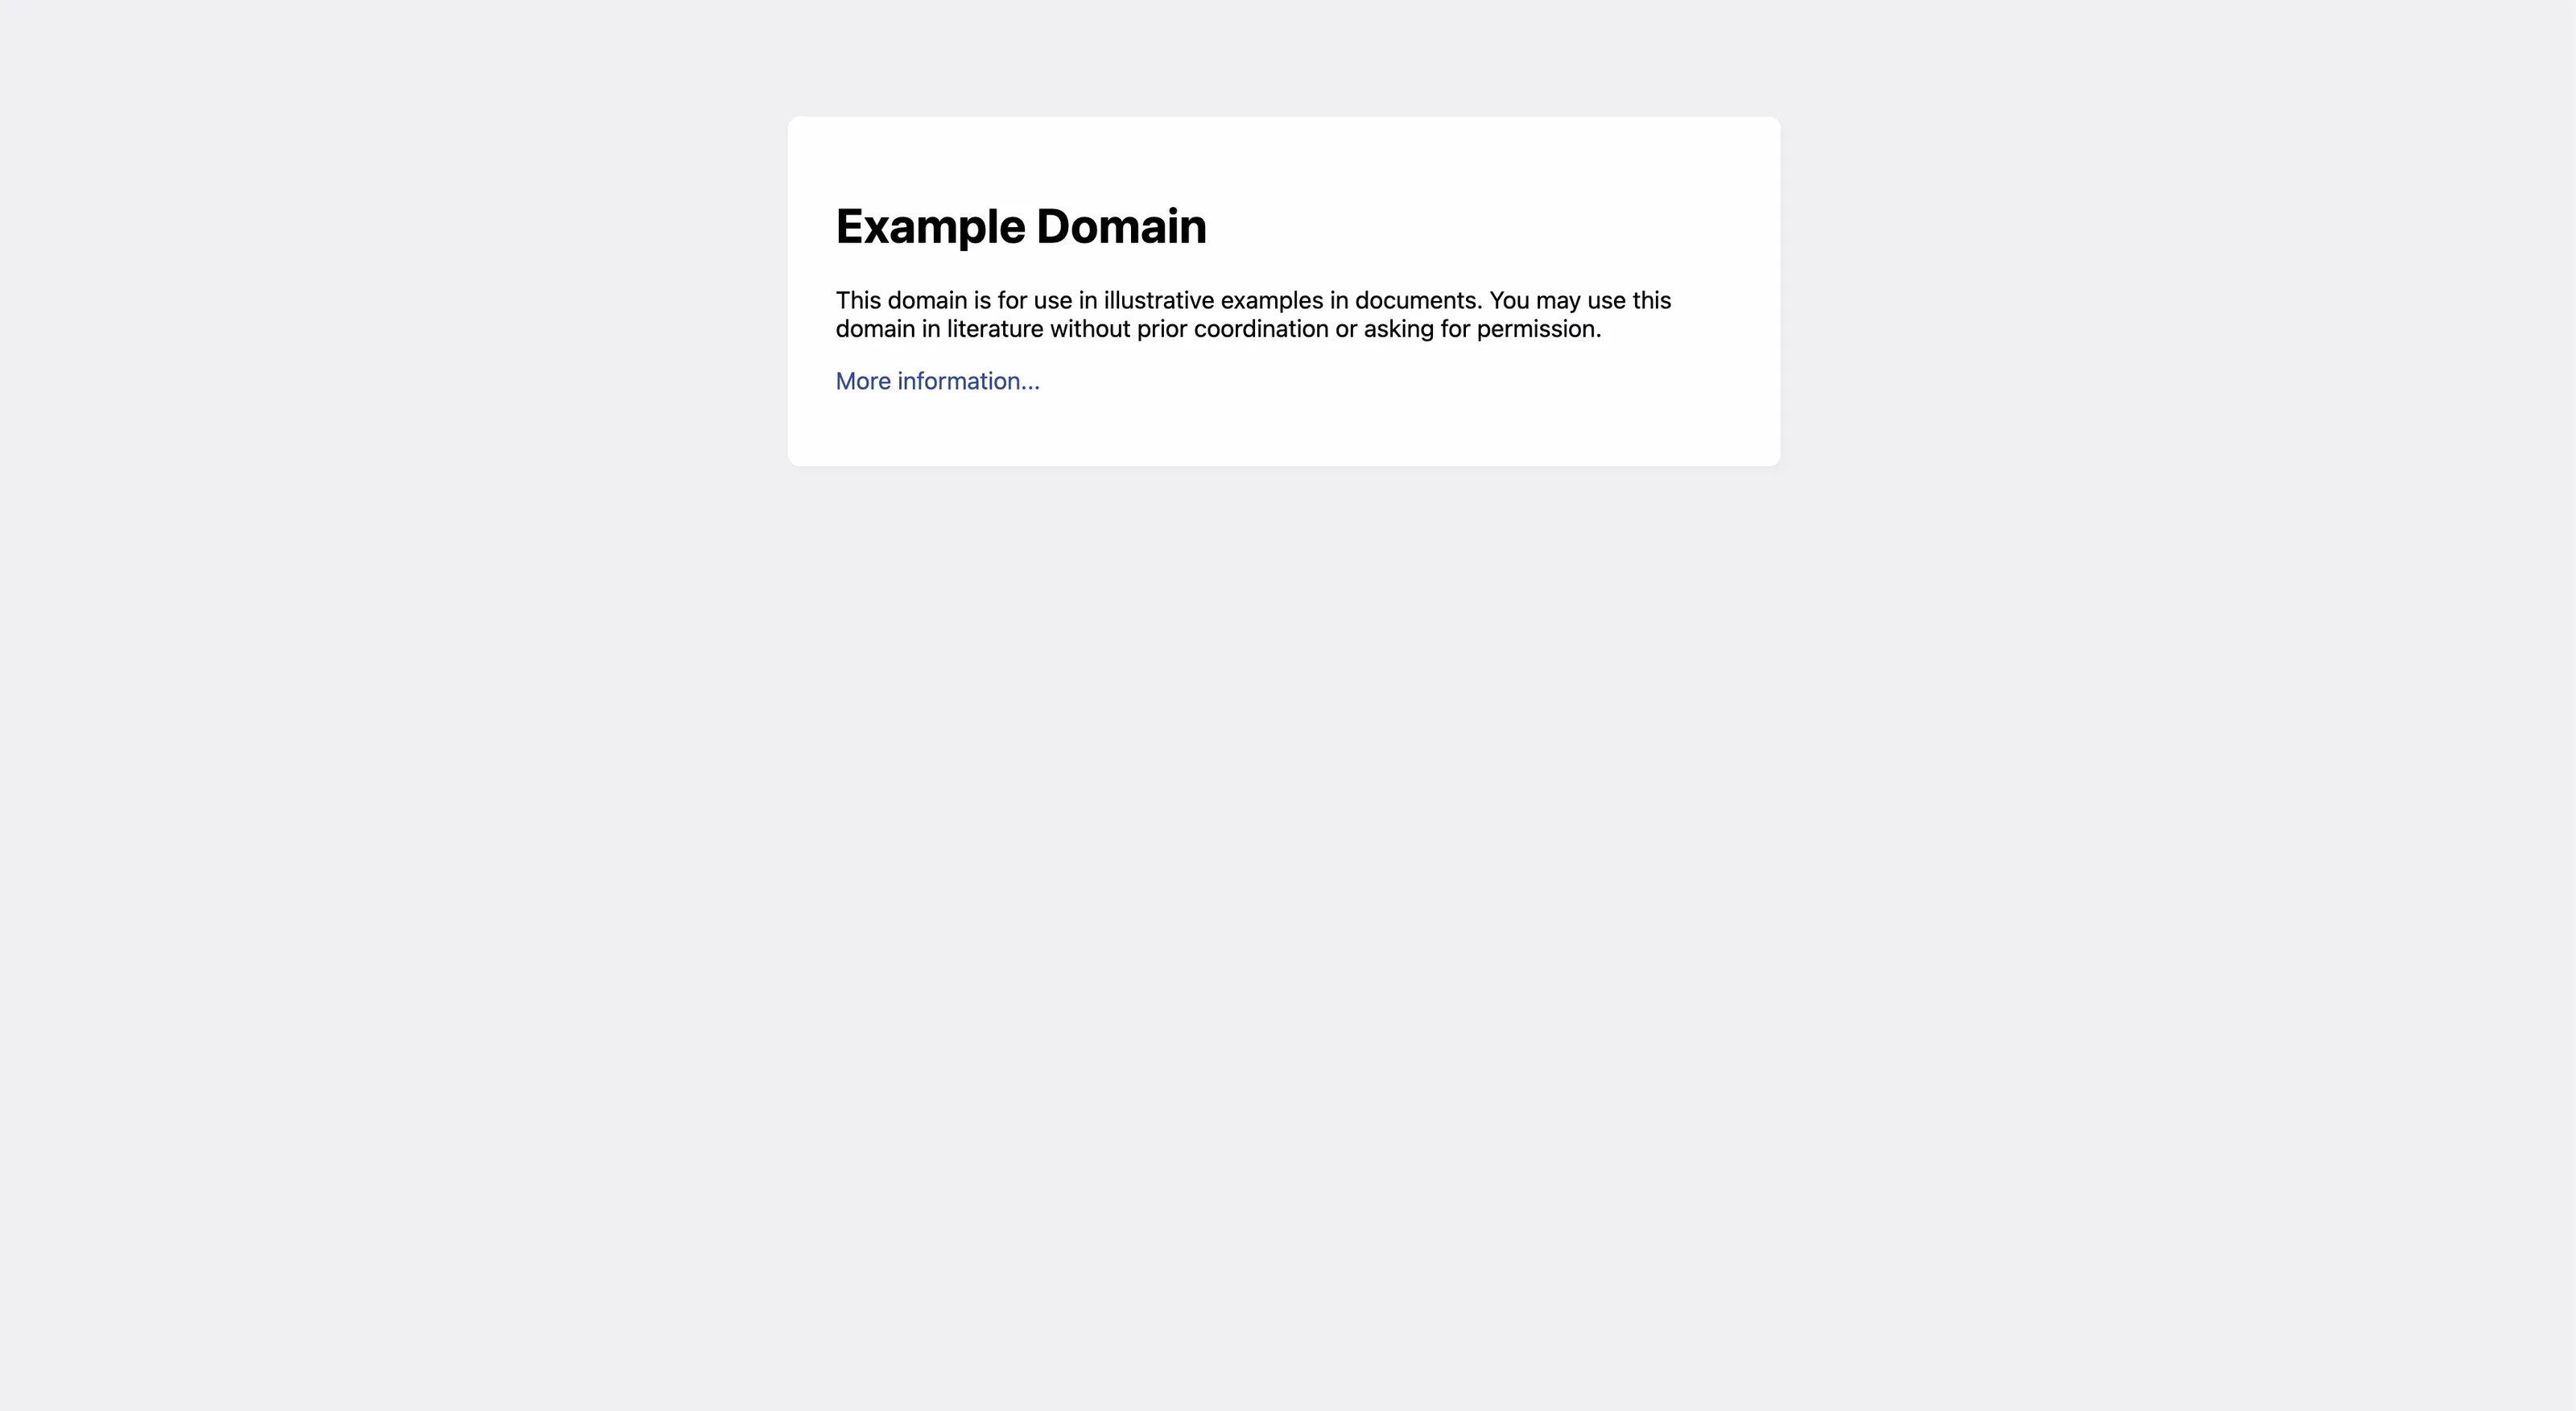
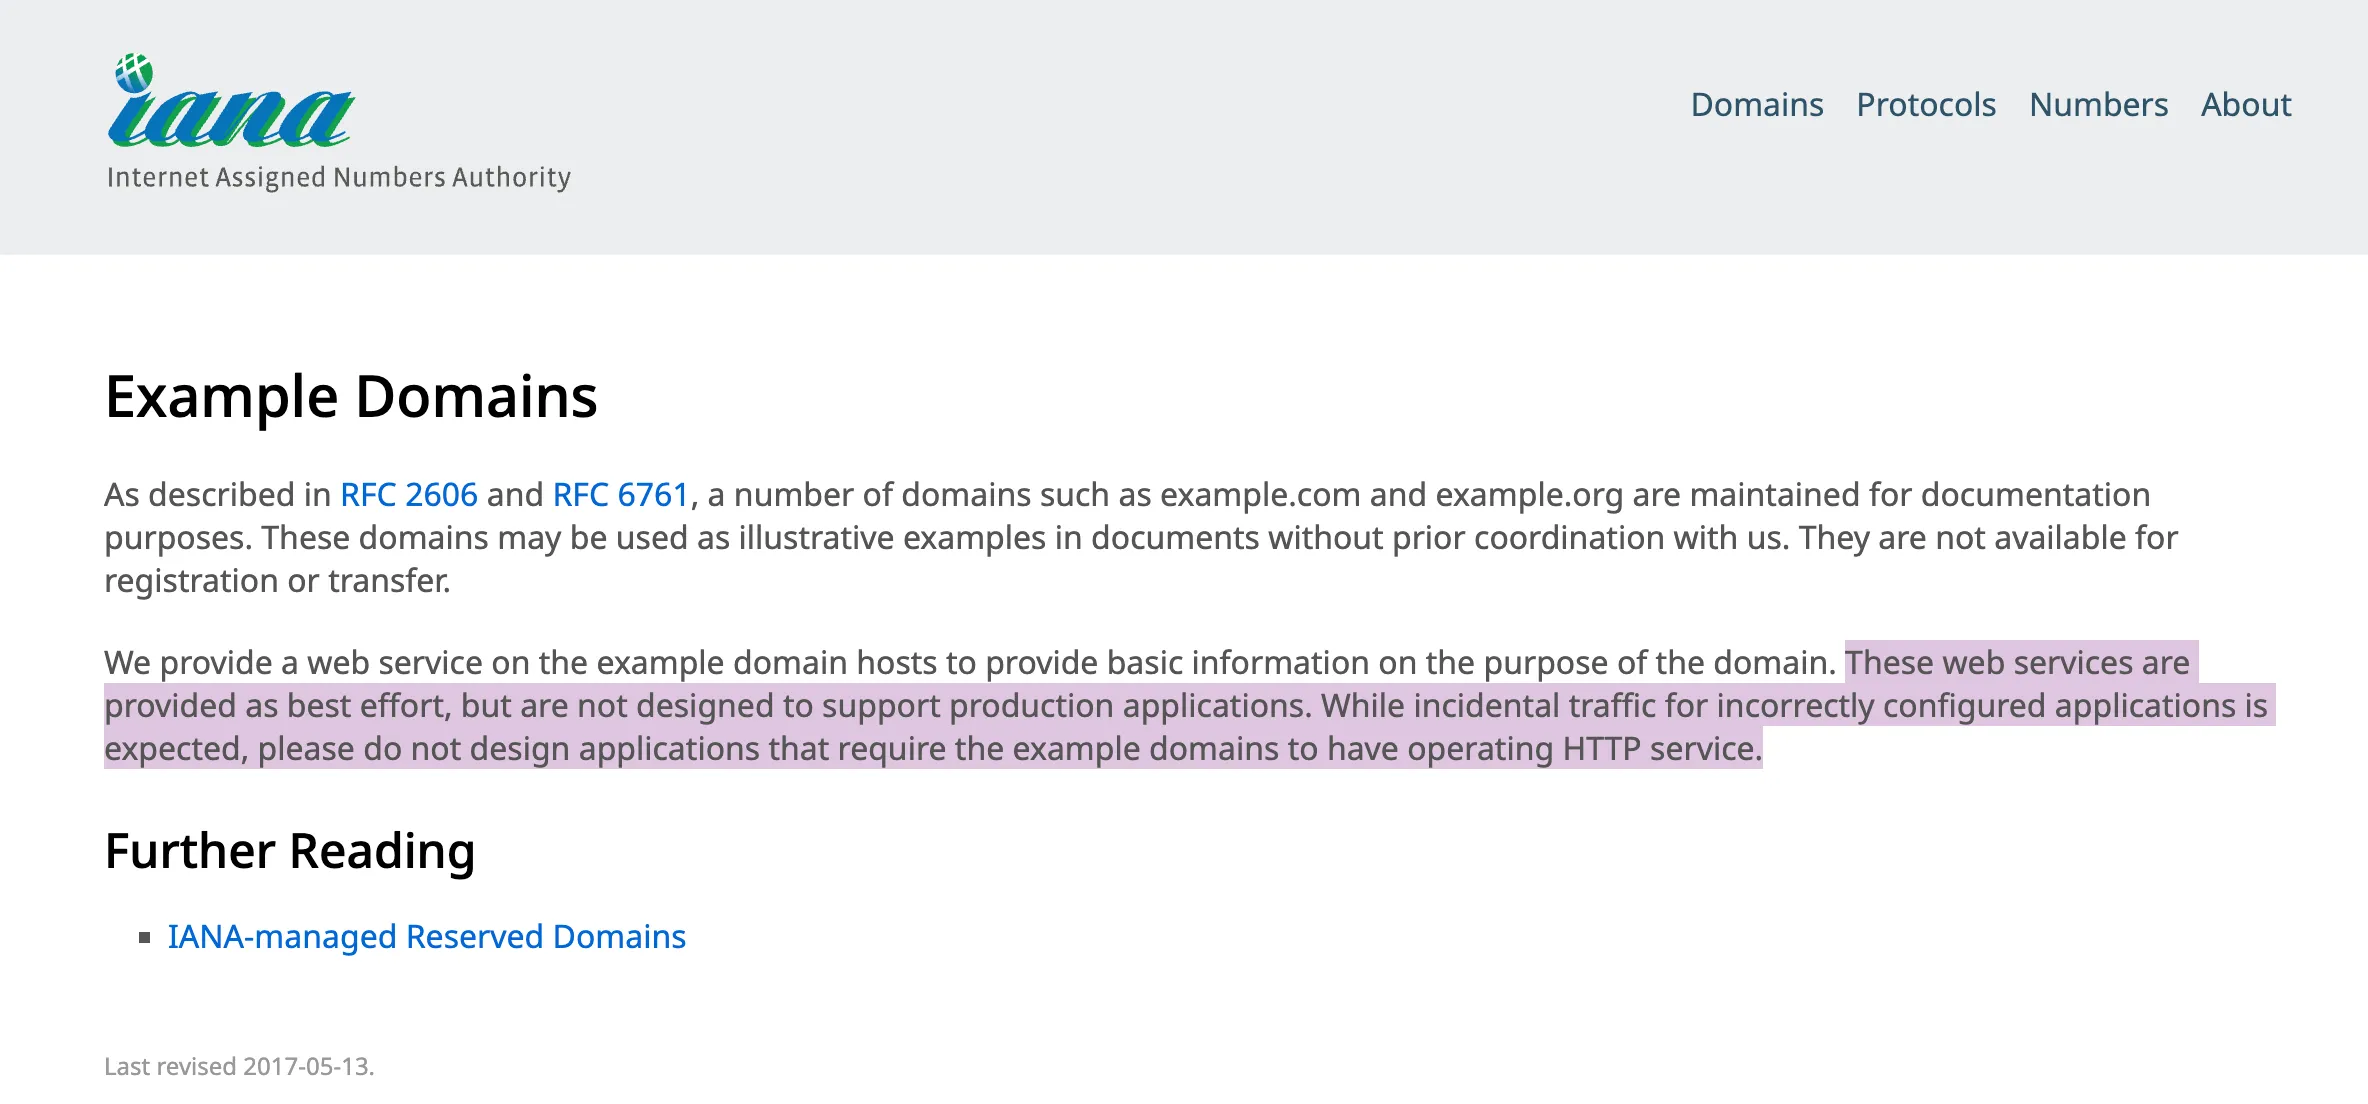
I started to question my sanity. The site I was screenshotting was literally example.com. It just works.
Getting closer to the issue
I started to render the ScreenshotOne.com landing page, and it worked perfectly.
Which made me think…
Wait, wait, wait… but what if example.com is not that stable?
And I checked. And indeed, turns out it might be blocking automated requests and is often inaccessible 😂 They probably improved protection or something.
But what if I only checked their documentation?
A few thoughts on AI
From one side, I wanted my monitor to be as close as possible to production checks.
But on the other side, it is based on something I don’t have control over at all.
One note about AI: no matter how I prompted it, it never suggested that it might be the issue.
But once I knew the issue, I saw how I could improve my prompting to get to the solution faster.
But how to do that with unknowns? It is still an open question for me.
Lessons learned
1. Trusted targets might fail, too
I didn’t expect example.com to fail. But it did. It is better to have my own controllable environment to test against. But make it as close as possible to the production environment.
2. The more monitors, the better
I have more than one monitor and it allowed me to still have some mental space because I knew that the customers were not impacted and the API kept working.
3. AI is not a silver bullet
It might help if you only know the solution. But what if you don’t? How to prompt it effectively is still a huge and open question for me.
4. Diagnostics tools are super important
If I had networking diagnostics tools, I would exclude these issues faster.
5. Failure is an opportunity to learn
First of all, I improved a lot of processes and tools on the way. But secondly, I still marketed my product a bit.
Last words
I hope you enjoyed the reading and learned something from my mistakes.
If you have any questions or are interested in website rendering, feel free to email at support@screenshotone.com.