Most things that you can do manually in the browser can be done programmatically using Puppeteer! But implementing browser automations in a server-side script makes it difficult to understand the resource consumption and performance implications of any step of the automation.
I’m Valerio, software engineer and CTO at Inspector, a tool that helps you find bugs and bottlenecks in your applications automatically. Before your customers stumble onto the problem.
One of the most useful things when it comes to monitoring is the ability to monitor not only the general execution performance, but build the timeline of all the individual tasks that make up the automation script.
Step 1: Create the project
To configure a new project create a new directory and run the init command inside it:
mkdir puppeteer-performance & cd puppeteer-performance & npm initIt will prompt you for input for a few aspects of the project, just press enter if you want to use the default values.
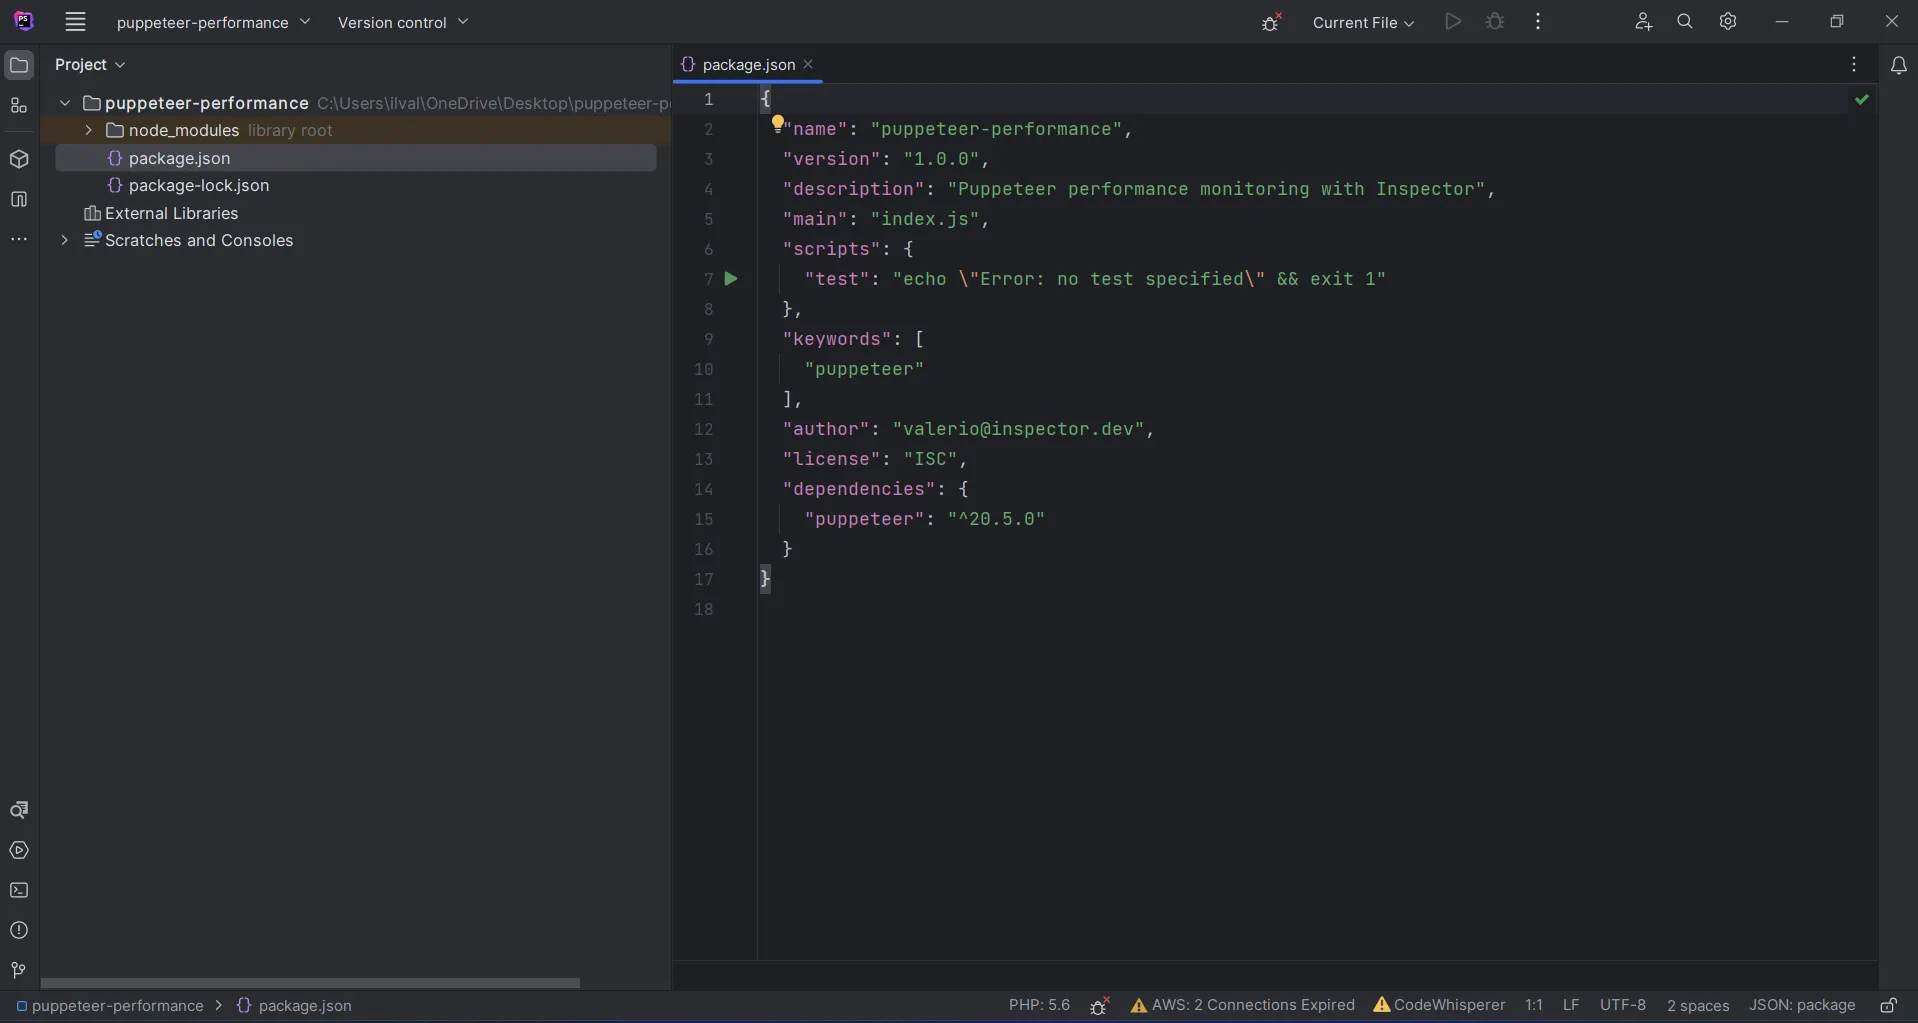
After completing the init process a package.json file will be generated and placed in the current directory.
Step 2: Install Puppeteer
Run the command below to install Puppeteer in your project:
npm install puppeteerDuring the installation process Puppeteer also automatically downloads a recent version of Chromium that will be used behind the scene to execute browser commands.
Step 3: Create the script
Now we can create the index.js file in the project directory. This is where we put the code to make screenshots with Puppeteer.
// Include Puppeteerconst puppeteer = require("puppeteer");
(async () => { // Create a browser instance const browser = await puppeteer.launch();
// Create a new page const page = await browser.newPage();
// Set viewport width and height await page.setViewport({ width: 1280, height: 720 });
// Open a URL await page.goto("https://screenshotone.com", { waitUntil: "networkidle0" });
// Capture screenshot await page.screenshot({ path: "screenshot.jpg" });
// Close the browser instance await browser.close();})();Execute the code by running node index.js in your terminal and you should see the new file “screenshot.jpg” appearing in the project directory.
We are ready to integrate performance monitoring.
Step 4: Install Inspector for Nodejs
Run the command below to install the Inspector nodejs module:
npm install @inspector-apm/inspector-nodejsAs recommended in the official documentation, you should initialize the module at the beginning of the script. Before requiring any other module.
To get an Ingestion Key you have to register an account on Inspector and create a new project.
Other than the initializing the module I start the transaction at line 15. This line tell Inspector to start monitoring.
/* * ------------------------------------------- * Initialize Inspector with the Ingestion Key. * ------------------------------------------- */const inspector = require("@inspector-apm/inspector-nodejs")({ ingestionKey: "9cd5715238227ada16ed0f0e2e5323434ce1437b",});
// Include Puppeteerconst puppeteer = require("puppeteer");
(async () => { // Start a transaction let transaction = inspector.startTransaction("puppeteer");
// Create a browser instance const browser = await puppeteer.launch();
// Create a new page const page = await browser.newPage();
// Set viewport width and height await page.setViewport({ width: 1280, height: 720 });
// Open a URL await page.goto("https://inspector.dev", { waitUntil: "networkidle0" });
// Capture screenshot await page.screenshot({ path: "screenshot.jpg" });
// Close the browser instance await browser.close();
transaction.setResult("success");})();After running the script you should see the new transaction coming in your dashboard:
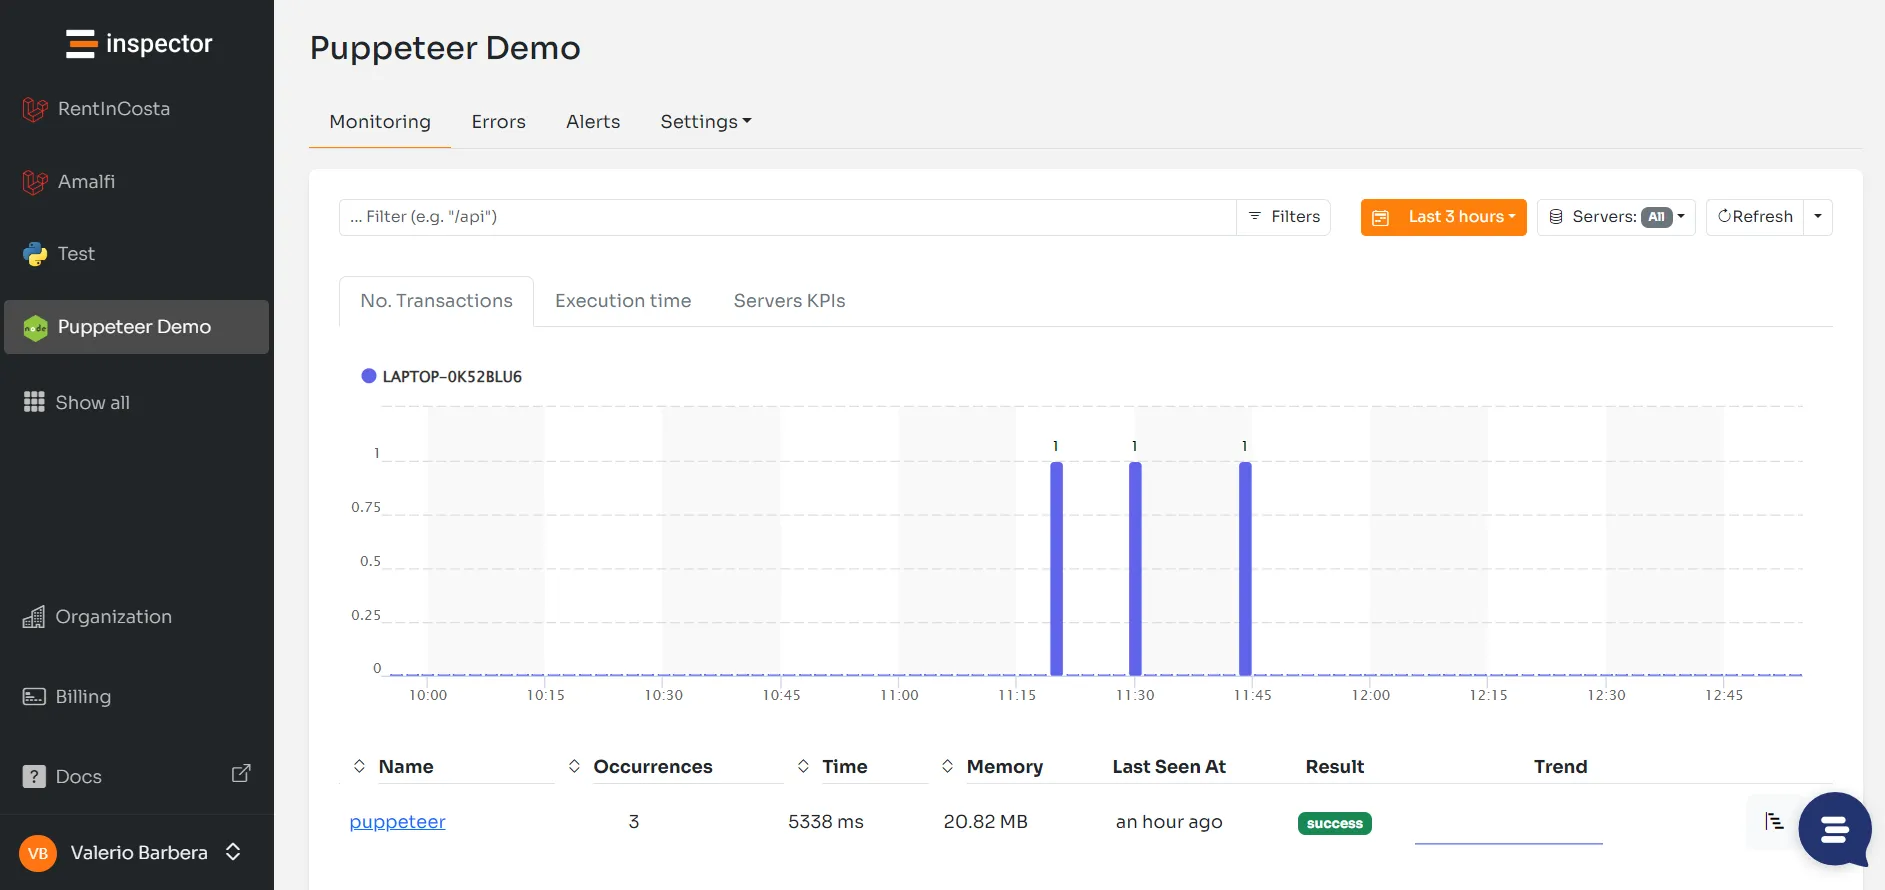
Now we are aware that the execution of the script takes 4.5 seconds and uses 18MB of memory. But… What is the impact of each statement inside the script?
Step 5: Enrich your timeline
The inspector library has a really simple API to add custom segments during a transaction. You can wrap any line of codes you write into the addSegment() method to monitor the impact they have within the execution flow.
Here is the script with segments:
/* * ------------------------------------------- * Initialize Inspector with the Ingestion Key. * ------------------------------------------- */const inspector = require('@inspector-apm/inspector-nodejs')({ ingestionKey: 'xxxxxxxxxxxxxxxxxxx'});
// Include Puppeteerconst puppeteer = require('puppeteer');
(async () => { // Start a transaction let transaction = inspector.startTransaction("puppeteer");
// Create a browser instance const browser = await inspector.addSegment(segment => { return puppeteer.launch(); }, 'launch');
// Create a new page const page = await inspector.addSegment(async segment => { console.log('Create a new page'); return await browser.newPage(); }, 'new-page');
// Set viewport width and height await page.setViewport({width: 1280, height: 720});
// Open a URL await inspector.addSegment(async segment => { await page.goto('https://screenshotone.dev', {waitUntil: 'networkidle0'}); }, 'goto', 'https://screenshotone.com
// Capture screenshot await inspector.addSegment(async segment => { await page.screenshot({path: 'screenshot.jpg'}); }, 'screenshot', true);
// Close the browser instance await browser.close();
transaction.setResult('success');})();Execute the script again running the command node index.js in your terminal.
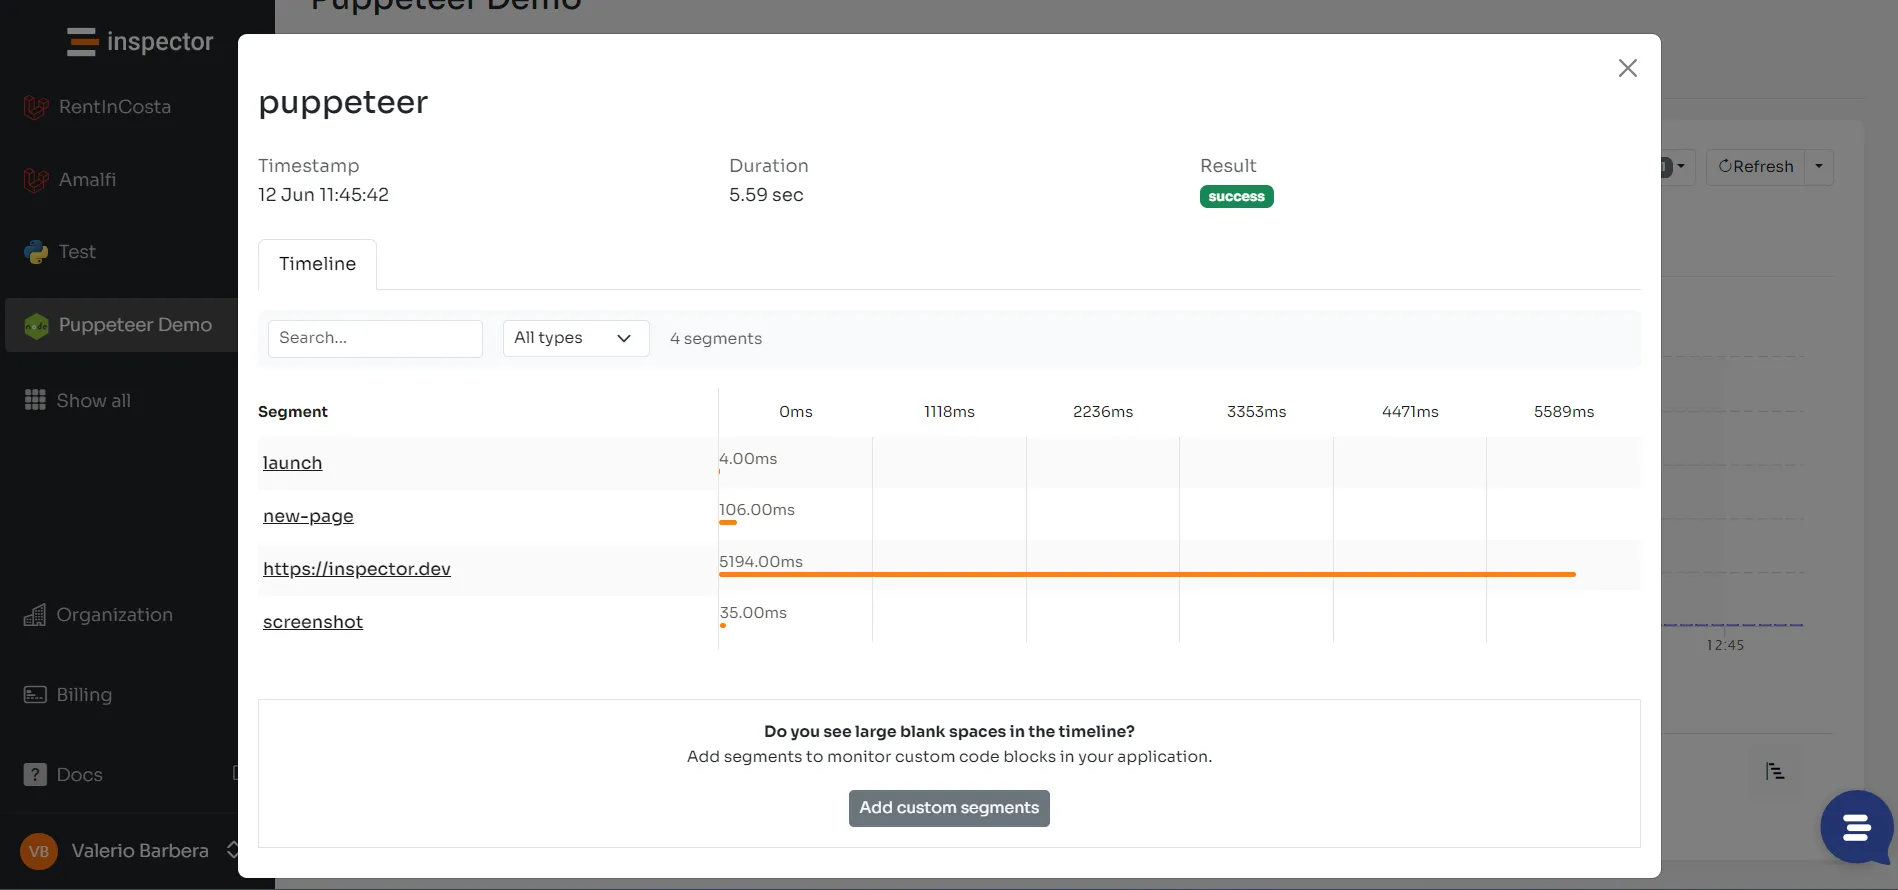
Now you can explore the execution details of each task in the script. And you will immediately see that the most impactful task is the opening of the URL.
Step 6: Detect Errors
It would be even more useful to receive alerts in case an exception is thrown at runtime and execution fails. The tool and the library should allow you to catch these events.
Inspector detects unhandled errors by default. You can try adding a throw statement to simulate an error making the screenshot.
/* * ------------------------------------------- * Initialize Inspector with the Ingestion Key. * ------------------------------------------- */const inspector = require('@inspector-apm/inspector-nodejs')({ ingestionKey: '9cd5715238227ada16ed0f0e2e5323434ce1437b'});
// Include Puppeteerconst puppeteer = require('puppeteer');
(async () => { // Start a transaction let transaction = inspector.startTransaction("puppeteer");
// Create a browser instance {...}
// Create a new page {...}
// Set viewport width and height {...}
// Open a URL {...}
// Capture screenshot (Throw Error) throw new Error('Unable to write file.');
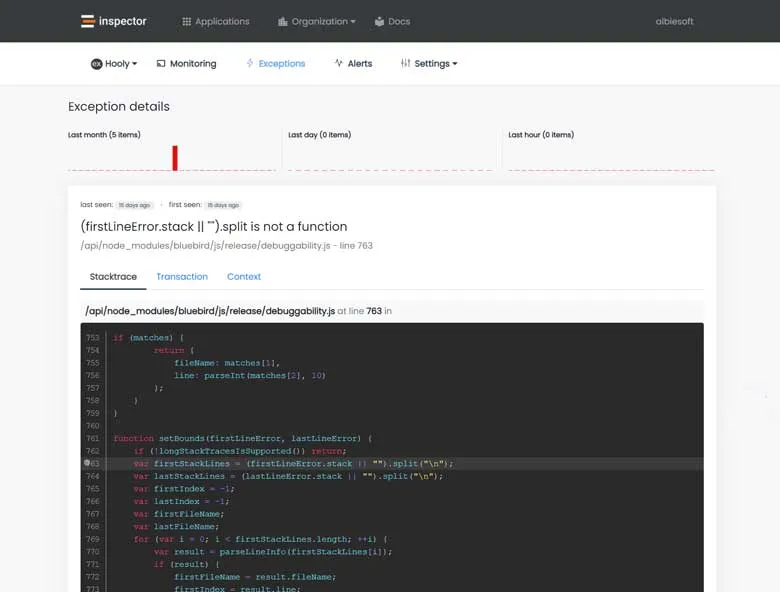
{...}})();You will immediately receive an alert via email and a complete report will be available in project dashboard.
Conclusion
I hope the code snippets have been helpful for you to better understand what performance monitoring is in practical terms.
You can use this script to compare the performance of different headless browsers for example (like, Puppeteer or Selenium) and make a better decision about which one to use in your scripts.
If you want learn more about Inspector, visit the official website—inspector.dev.